Know what changed before it matters.
See what changed at any company, why it matters, and the evidence behind every number.
Read before investment committees, board meetings and corp-dev screens. Agencies use it to ground client strategy in measured readings. Who it’s for ›
Look up a real company. Read real output.
A live search across 7,000+ companies we have read. Search free for the public facts, see which findings we hold, and get the headline finding by email when you join Qravitas Insights. The scores themselves are in the workspace and the Board Pack.
Scores and findings are computed by the engine from public disclosure and digital signal, with provenance. Sample is read-only and refreshed from the evidence base.
What you open every morning.
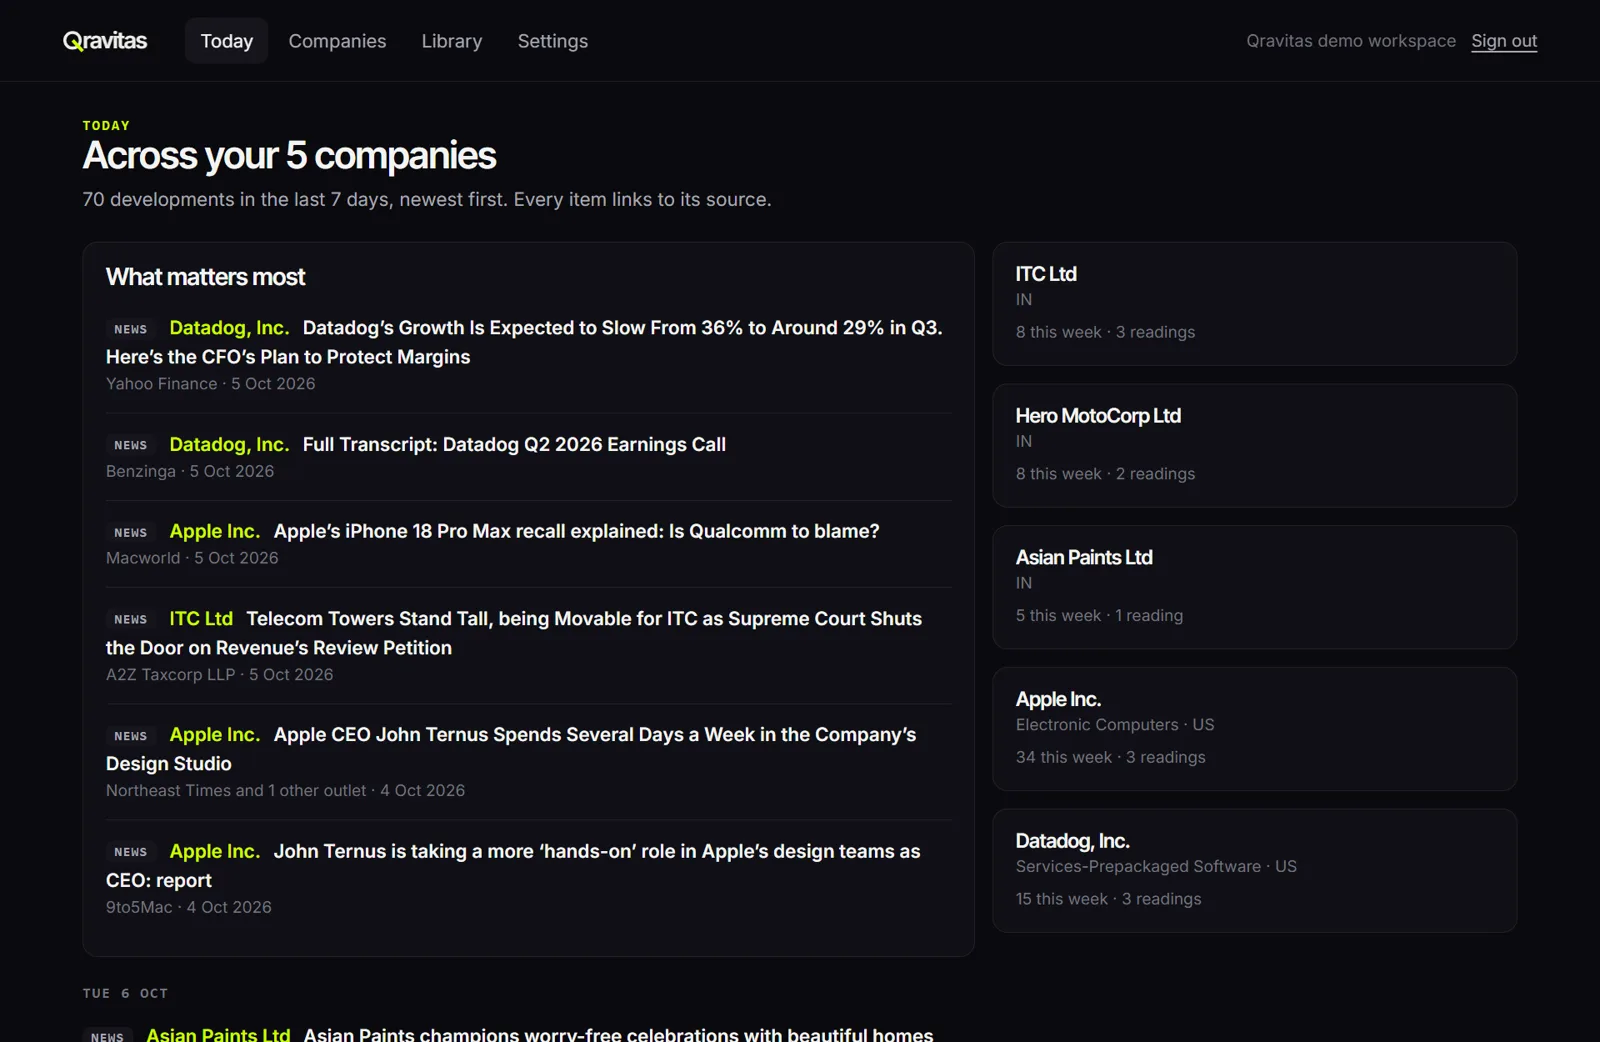
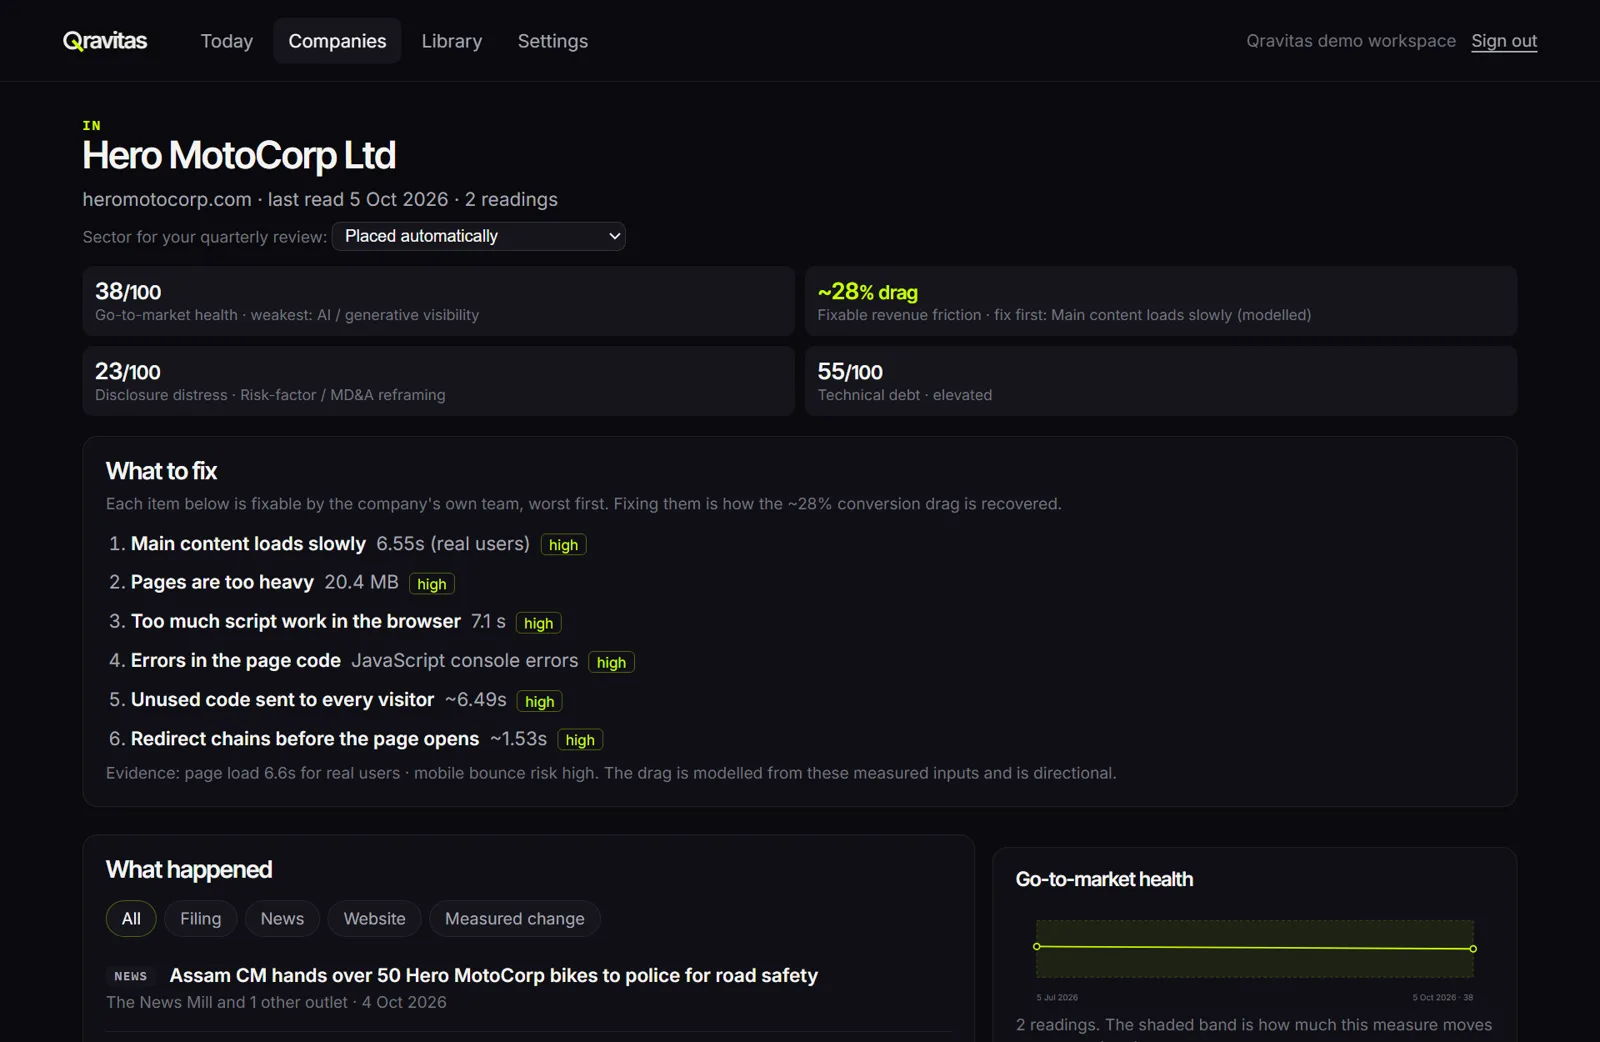
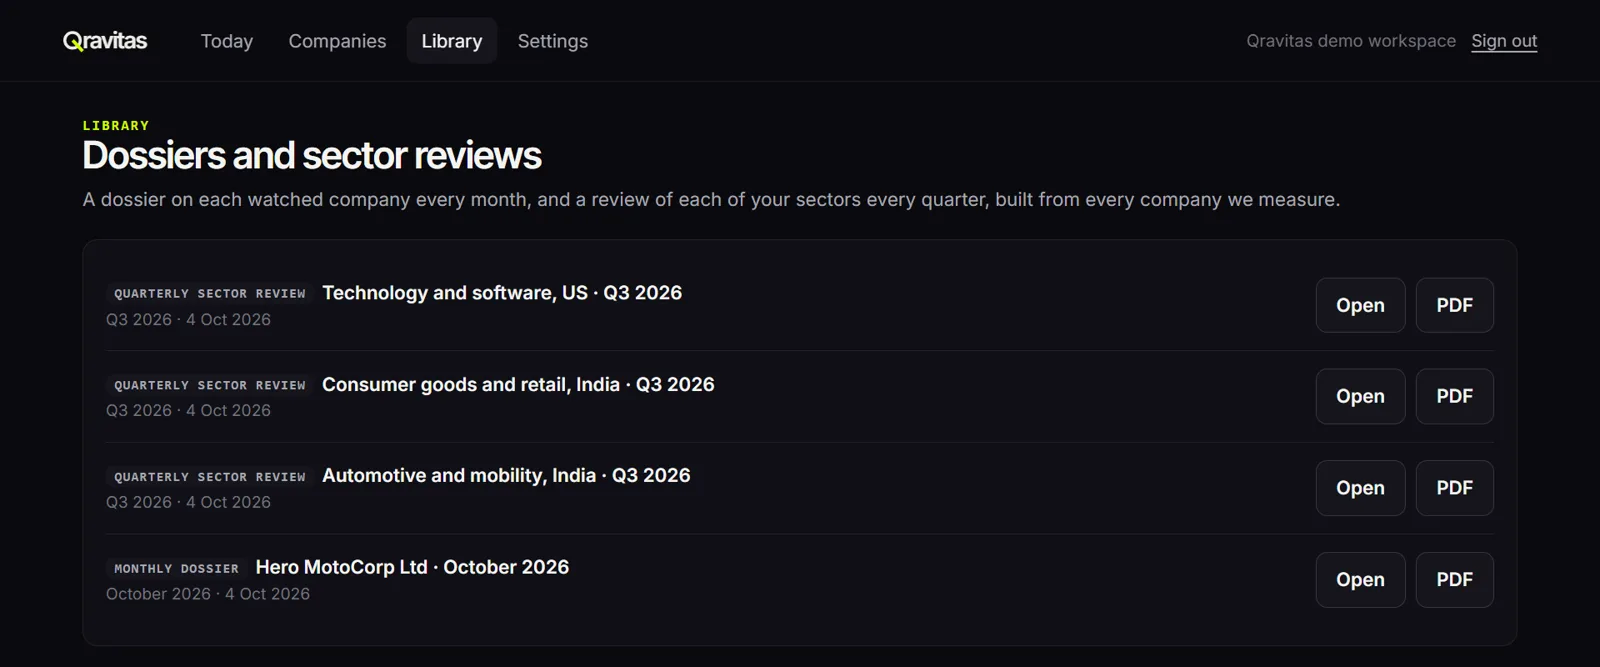
Sign in, choose the companies you watch, and Qravitas keeps reading them. Filings, news, website changes and measured moves arrive in one feed, each with its source a click away. The screens below are the product on live data. Limited access: the workspace is opening to free sign-ups now, and it keeps evolving with the teams who use it.
Recently shipped
- Oct 2026Add any organisation to a watchlist, listed or private, and set its parent group.
- Oct 2026Competitive sets: put your own competitors next to each company you watch.
- Oct 2026Quarterly sector reviews, placed against every company we measure in the sector.
- Oct 2026Monthly dossiers with a print-ready PDF edition.
- Oct 2026Trading tips and market wraps filtered out of the feed.
Design partners
We are taking a small number of teams who want to shape what gets built next: which signals matter, which sectors to go deeper on, what the board pack should answer. Partners get the workspace on founding terms and a direct line to the people building it.
The evidence base is the asset.
More than 9,000 companies read, 7,000+ of them searchable in the public lookup. Every company observed adds resolved entities, weighted relationships, and validated findings to one cross-company knowledge graph, so each new audit is grounded in everything the evidence base already knows. This is accumulated organizational memory, and it is not reproducible in a quarter.
Every company resolved to one record across filings, its own site, news and hiring, then placed among its real peers.
Every link is derived from evidence, not assumed, and carries a relationship type, a weight, and a confidence.
A finding on one company is scored against its cluster. Each peer carries its own Revenue Friction Index.
The same evidence base. Three ways to use it.
One platform underneath. Every product below runs on the same evidence base and the same cross-company knowledge graph, so a signal found by one sharpens the other two.
A board-grade read on one company
A board-grade executive dossier on any company: the one question that ranks above the rest, the strategic chain from signal to economic stake, and every claim cited. Sold as the Board Pack. Pricing on request.
Keep a company under a standing read
Media and communications spend against observable outcomes, funnel alignment, martech maturity and earned-media position, re-read on your term. Sold as Marketing Intelligence. Pricing on request.
Find the right companies. Know why now.
Signal-led prospecting from evidence base signals: expansion moves, stack changes, hiring surges, growth constraints. A ranked list with the evidence and the reason to reach out, not a bigger spreadsheet.
Every conclusion links back to evidence.
A static report decays the day it ships. Qravitas runs continuously, so the readings stay current and every number stays traceable to its source.
Grounded intelligence
Every finding is checked against the evidence on file and scored against real peers, and it carries a confidence, so each finding states its evidence and its confidence rather than a model’s opinion.
Change you can trust
Companies are re-read on a rolling basis and every reading is dated. A change is reported only when it is larger than the instrument’s own noise across three readings taken on separate days, so you see movement, not jitter.
End-to-end provenance
Every metric carries provenance: source citation, confidence score, and decision traceability from raw signal to board sentence. The share of claims grounded in measured evidence is published below, with the date it was measured.
Measurable, today.
Measured from the evidence base on 2 Nov 2026. “Grounded” means a quantified claim is supported by that company’s measured evidence, checked across 3,607 records covering 16,059 claims. It is not a forecast: validation against realised outcomes is work in progress with design partners and is not yet published. Method on the methodology page.
Enterprise software has systems for finance, security, engineering, and operations. It has no system for reasoning about growth. That is the gap Qravitas exists to fill.
The work is systems, not campaigns: continuous observation, a cross-company knowledge graph, and grounded analysis that produces explainable, board-ready analysis. The team builds it after years inside enterprise growth, where the recurring failure was structural rather than tactical. Every function had instrumentation. Nothing reasoned across them.
Who uses Qravitas.
One platform, read outside-in from public signals. Each team uses the same evidence for a different decision. Qravitas is the software you run; you own the relationship and the call.
See your own growth friction
Read your company the way the market already can, and get an evidence-backed view of where growth is constrained, benchmarked against real peers.
An evidence layer under your work
Ground strategy and pitches in cross-company evidence before the work begins. You own the client and the execution; Qravitas is the evidence beneath it.
Read a target before the data room
Screen and diligence companies from public signals, with confidence-scored findings and full evidence traceability, before the process starts.
Keep every target current
Monitor a full set of targets and competitors continuously, with evidence attached to every movement, so research never goes stale on delivery.
A live read on where growth is constrained
Run a continuously updated Revenue Friction Index across the companies you care about, grounded in cited evidence with confidence scores.
Point it at your universe
Apply outside-in analysis and grounded reasoning to a specific set of companies. Custom & Enterprise, scoped to the engagement.
Notes on how companies grow, and how to measure it.
Outside-in due diligence
What investors can know from public signals before the data room opens.
What thousands of companies show
Statistics measured across the companies we read, each with its sample size and method, free to cite.
Why a graph beats a dashboard
A dashboard describes one company. A graph that has seen thousands can judge it.
What we see on company websites, free to use
Company-level readings with their date and method. No key, no sign-up.
How many company websites still load Universal Analytics?
A Google tag that stopped collecting in July 2023.
How often do websites lose UTM tags on a redirect?
When they do, the channel that earned the visit gets no credit.
How many websites tell AI engines who they are?
The short block of markup most home pages still lack.
What share of websites load fast for real visitors?
Real Chrome visits, not a lab estimate.
How many US-listed companies rewrote their risk factors?
Annual reports read against the year before.
Marketing intelligence vs competitive intelligence
Which kind of tool answers which question.
Competitive intelligence software: a buyer's guide
What to ask before you buy.
Portfolio monitoring for private equity
Watching holdings from the outside, between reporting cycles.
Common questions.
Qravitas is a company monitoring and dossier platform. It reads any company outside-in from public signals, builds a cross-company knowledge graph, runs grounded, board-grade inference, and produces a Revenue Friction Index that shows where growth is constrained. It is software, not an agency.
No. Marketing, consulting, SEO, and RevOps are implementation layers. Qravitas is a software product that observes, reasons, and produces a board-grade dossier. It does not run campaigns or replace your team.
The Revenue Friction Index is one score for where a company’s growth is constrained, broken into confidence-scored dimensions and benchmarked against real peers. It updates as new evidence arrives. It describes the position today; it is not a forecast.
Findings are scored by evidence depth and checked against the cross-company evidence base. Validation against realized outcomes is the active work with design partners, comparing predicted friction to subsequent results. Grounding is not prediction: a claim can be fully supported by evidence and still not forecast what happens next, so we publish the two separately and do not yet publish a predictive accuracy figure.
Companies are re-read on a rolling basis: 6,298 were read in the last 30 days, 3,650 of them re-reads. Every reading adds to that company’s history, and a change is reported only once it is larger than the instrument’s own noise across three readings taken on separate days. Counts on this page are measured from the evidence base and dated.
It reads companies outside-in from public signals: website and performance, search visibility, reviews, hiring, pricing, filings, and competitive movement. No onboarding or internal data access is required to start, which is what lets it analyze any company.
Yes, by design. Outside-in analysis requires no access and is how every engagement starts. From there the platform embeds into internal systems such as RevOps, CRM, and ERP through private data connectors, so diagnostics run against live internal data and governance is sustained rather than episodic. The data boundary is strict: your first-party data stays yours, is used only for your own diagnostics, and never enters the shared evidence base or the cross-company graph, which are built entirely from public signals. Connectors are in development with design partners.
Ask for pricing on the request page with the company and the decision it is for, and we reply within one business day. Following a company yourself is free in a Qravitas workspace. Read a real sample first at qravitas.com/sample-dossier.
Three ways to start.
Look up any of 7,000+ companies we have read for free. Commission a board-grade Board Pack on one company. Or follow the companies you live with, free, in your own workspace.
Payments are not taken online yet; quoted work is invoiced. Or email hello@qravitas.com.